
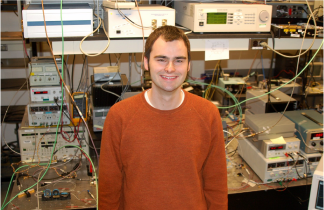
From Arjun G. Yodh, Biomedical Optics Group, University of Pennsylvania MRI axial slice, DOT axial slices of relative total hemoglobin concentration (rTHC), relative blood oxygen saturation (rStO2), relative tissue scattering (rSc), Optical Index, and a 3D image of region of interest are shown for malignant (left-side) and benign lesions (right-side). The black line indicates the tumor region.
I arrived at CLEO this afternoon bleary-eyed from a long plane ride and lack of sleep. However, three talks in CLEO Applications: Spectroscopy and Imaging held my attention firmly. What impressed me the most was how much information the particular researchers extracted from tissue or a tumor using what seemed like a small amount of data or rudimentary tools.
In presentation AMD4, Arjun Yodh, from University of Pennsylvania demonstrated the power of using highly scattered light from a tissue to not only reconstruct an image deep beneath the tissue surface (~ 1 cm), but to also gather functional information such as blood flow to and from a tumor. This technique, called diffuse optical tomography, relies on a diffusion model of photons through tissue, analogous to the diffusion of heat. In the figure above, Yodh and his collaborators could distinguish between malignant and benign breast tumors based on the functional information from diffuse scattering and absorption.
In presentation AMD1, Urs Utzinger from University of Arizona, showed fairly high specificity and selectivity in diagnosing ovarian cancer in post-menopausal patients by fluorescence signals, using UV-A to Near-IR excitation. Selectivity was accomplished by compiling and comparing excitation-emission matrices for malignant and benign tumors. Each value of an excitation-emission matrix is simply the intensity of the emission signal, where the rows of the matrix corresponds to the excitation wavelength and the column corresponds to the emission wavelength.

From SPIE,Response of cellular motility to the drug nocodazole. The initial state shows strong motility in the outer healthy shell, decreasing over approximately 1h as the microtubules are disassembled inside the cells. The bar is 100μm.
Finally, in presentation AMD3, David Nolte, of Purdue University showed that he could diagnose the effects of drugs on a tumor by how much it wiggled and shook- its motility, see the picture above. My favorite figure in his talk showed the frequency and strength of cell oscillations as a function of time after a drug or another kind of stimulus, such as heat, had been introduced. What part of the cell wiggled depended additionally on its health indicating motility can be used to label a cell's state.
No comments:
Post a Comment